Only 10% Can Guess the Candlestick Patterns
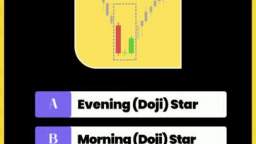
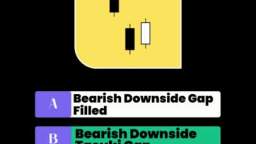
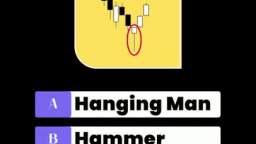
Guess These Forex Candlestick Patterns??🤔🤔
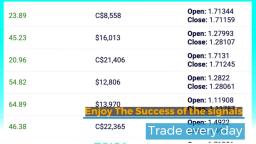
A Candlestick Is A Way To Represent An Aggregation Of All The Prices Traded For A Given Time Period. It Can For Example Aggregate A Full Trading Day Of Prices. During This Time Period (Which Can Take Any Value, From 1 Minute To A Few Months), Instead Of Showing Every Single Price Traded, A Candlestick Will Only Show 4 Price Values :
High : The Highest Price Reached During This Period
Low : The Lowest Price Reached During This Period
Open : The First Price Traded During This Period
Close : The Last Price Traded During This Period
Category:
 More From: LearnForexTrading
 Related Videos
0 ratings
11 views

Want to add this video to your favorites?
Sign in to VidLii now!
Sign in to VidLii now!
Want to add this video to your playlists?
Sign in to VidLii now!
Sign in to VidLii now!
Want to flag this video?
Sign in to VidLii now!
Sign in to VidLii now!
 Video Responses (0)
| Date: |
Views: 11 | Ratings: 0 |
| Time: | Comments: 0 | Favorites: 0 |


