How to Recognize the Bullish Hammer Candlestick Pattern
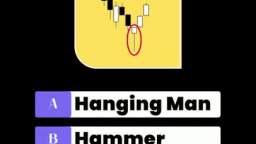
One of the most popular chart patterns in trading is the Bullish Hammer. It is based on the Hammer candle. It has a small body and a lower shadow that is at least 2 times the size of the body. The closing price is higher than the opening price. The large shadow below shows that after the opening of the candle, sellers tried to push the price down, but buyers turned out to be stronger and pulled the price up.
Category:
Tags:
 Related Videos
0 ratings
14 views

Want to add this video to your favorites?
Sign in to VidLii now!
Sign in to VidLii now!
Want to add this video to your playlists?
Sign in to VidLii now!
Sign in to VidLii now!
Want to flag this video?
Sign in to VidLii now!
Sign in to VidLii now!
| Date: |
Views: 14 | Ratings: 0 |
| Time: | Comments: 0 | Favorites: 0 |


